
ClimateSERV
This tool allows development practitioners, scientists/researchers, and government decision-makers to visualize and download historical rainfall data, vegetation condition data, and 180-day forecasts of rainfall and temperature to improve understanding of, and make improved decisions for, issues related to agriculture and water availability. Share
Share
Launch ClimateSERV
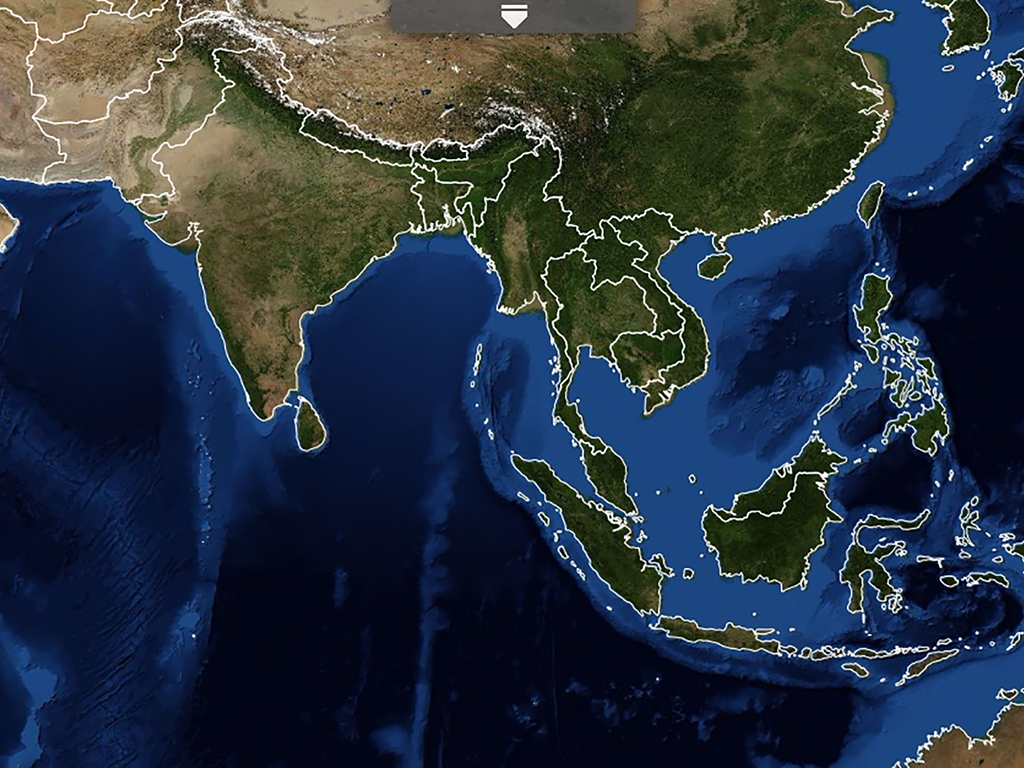
In SERVIR regions, where long-term ground observations of rainfall are sparse, there is a critical need for satellite and model-derived rainfall data for predicting droughts, estimating crop yields, and more. Decision-makers need a way to accurately assess how severe a drought will be, how it compares to past droughts, and its potential effect on crop yields. Such assessments require accurate estimations of rainfall variations in space and time. It is important to place an evolving dryer-than-normal season into historical context in order to analyze the severity of rainfall deficits. Until now, such analyses used rainfall data from specific points on the Earth's surface. However, that data fails to show the region-wide variability that reveals comprehensive rainfall patterns.
Application Purpose
SERVIR has created a user-friendly, web-based tool -- ClimateSERV -- that provides three important datasets together in one system to help decision-makers in SERVIR’s data-sparse regions assess the evolving situation via holistic analysis of water and agriculture. Using ClimateSERV, development practitioners, scientists/researchers, and government decision-makers can readily analyze historical rainfall for the past 30 years and compare it with the best available forecasts for the next 180 days for their defined area of interest to improve understanding of, and make improved decisions for, issues related to agriculture and water availability. The three key datasets that ClimateSERV provides to make this possible are as follows: (1) Climate Hazards group IR Precipitation with Stations (CHIRPS): Scientists at Famine and Early Warning System (FEWS NET) who are members of the SERVIR Applied Sciences Team used 30 years’ (1982- present) worth of multiple satellite data sources and ground observations to produce an unprecedented, global, spatially and temporally consistent and continuous 30-year record of satellite-derived rainfall data. This CHIRPS global dataset makes it possible to accurately assess and monitor large-scale rainfall patterns and analyze how they may be affected by climate change. The data are updated to the latest available rainfall estimates. (2) North American Multi-Model Ensemble (NMME) dataset: Forecasts of future precipitation are also critical to decision-makers. The NMME dataset, a compilation by National Oceanic and Atmospheric Administration (NOAA), reflects cutting edge work on seasonal forecasting. A SERVIR AST project has taken the NMME data and performed bias correction and spatial disaggregation using standard, well-accepted techniques to generate daily, 180-day temperature and precipitation forecasts for the entire globe. These seasonal forecasts, along with the CHIRPS historical rainfall data, provide an overall perspective to connect rainfall patterns from the past to future rainfall (up to 180 days out) as projected by NMME. (3) MODIS-derived Normalized Difference Vegetation Index (eMODIS NDVI): SERVIR is also piloting the USGS pentadal eMODIS NDVI dataset at 250m spatial resolution over West Africa. NDVI, a measure of vegetation condition, provides a proxy for agricultural productivity by showing photosynthetic activity. By providing this 15 year dataset, SERVIR is enabling Ministries of Agriculture and the international donor community to explore how CHIRPS and NMME data link to vegetation growth and health. (The NDVI dataset is being expanded to other parts of Africa and beyond.) ClimateSERV enables decision-makers to link historical precipitation trends (CHIRPS) to past vegetation trends (NDVI) to gain insight into potential vegetation growth and health based on seasonal (up to 180 days) precipitation and temperature forecasts (NMME).
Application Uses
With this tool, decision-makers can download, view, graph, and interpret the CHIRPS, eMODIS NDVI, and NMME seasonal forecast data in a web-based user interface. ClimateSERV can help decision-makers assess and monitor large-scale rainfall patterns, analyze how those patterns may be affected by climate change, determine likelihood of drought, and infer crop condition. Kenya Meteorological Service field offices are already using the data to provide climate resilience guidance to farmers. For example, KMS’s Kericho office is using the CHIRPS dataset to downscale seasonal climate outlooks for farmers’ use in planning crop cultivars and planting times. SERVIR hubs plan to train end-users in their regions to use and analyze the CHIRPS, NMME, and NDVI data through ClimateSERV. Use of seasonal forecasts by end-users has been increasing. ClimateSERV will assist in the conversion of these large datasets into actionable information.
Launch ClimateSERV
Consortium Subawardees
Co-Developer(s)
SERVIR Science Coordination Office